

What surprises will the stock market hold in 2023?
What surprises will the stock market hold in 2023?

With the benchmark S&P 500 down 19% and the Nasdaq 100 down just over 32%, 2022 wasn’t a exactly a vintage year for equities. It was the largest overall drawdown in the stock market since 2008, and while there were some pockets of profitability, most notably in energy stocks, some shares suffered far worse than the headline indices would suggest, particularly in the most ‘growthy’ part of the tech sector.
While it is tempting to look at how rare it is for the stock market to fall two years in a row, it is worth remembering that dividing market performance into year-long slices that start in January is somewhat arbitrary, seasonal flows (relating to tax and other considerations) notwithstanding.
A more sensible approach to looking at how equities might perform in 2023 is first to assess what market liquidity looks like at present, especially with central banks tightening monetary policy, and then to assess equity market valuations in the context of how the economy is performing or is likely to perform in the coming year.

While 2022 was a tough year for equities, there weren’t really any periods when the market really collapsed as it did during the first phases of the pandemic in 2020 or during ‘Vol-mageddon’ in Q1 2018. Looking at why the market declined but ‘only’ in a stable and orderly fashion (despite rapid central-bank rate hikes, especially in the US) provides a good starting point for understanding the market’s liquidity backdrop.
When market indices which are normally highly correlated start to diverge in an unusual fashion, it is a sign that something is up in one or both of the measures concerned. The graph below shows the VIX index (which measures 1-month forward implied volatility on the S&P 500 index) alongside the MOVE index (a similar measure as the VIX, but for the US Treasury bond market). The bond market’s reaction to the Fed’s aggressive rate hikes are obvious to see, so it is the VIX index which looks unusually subdued in the circumstances. Why so?
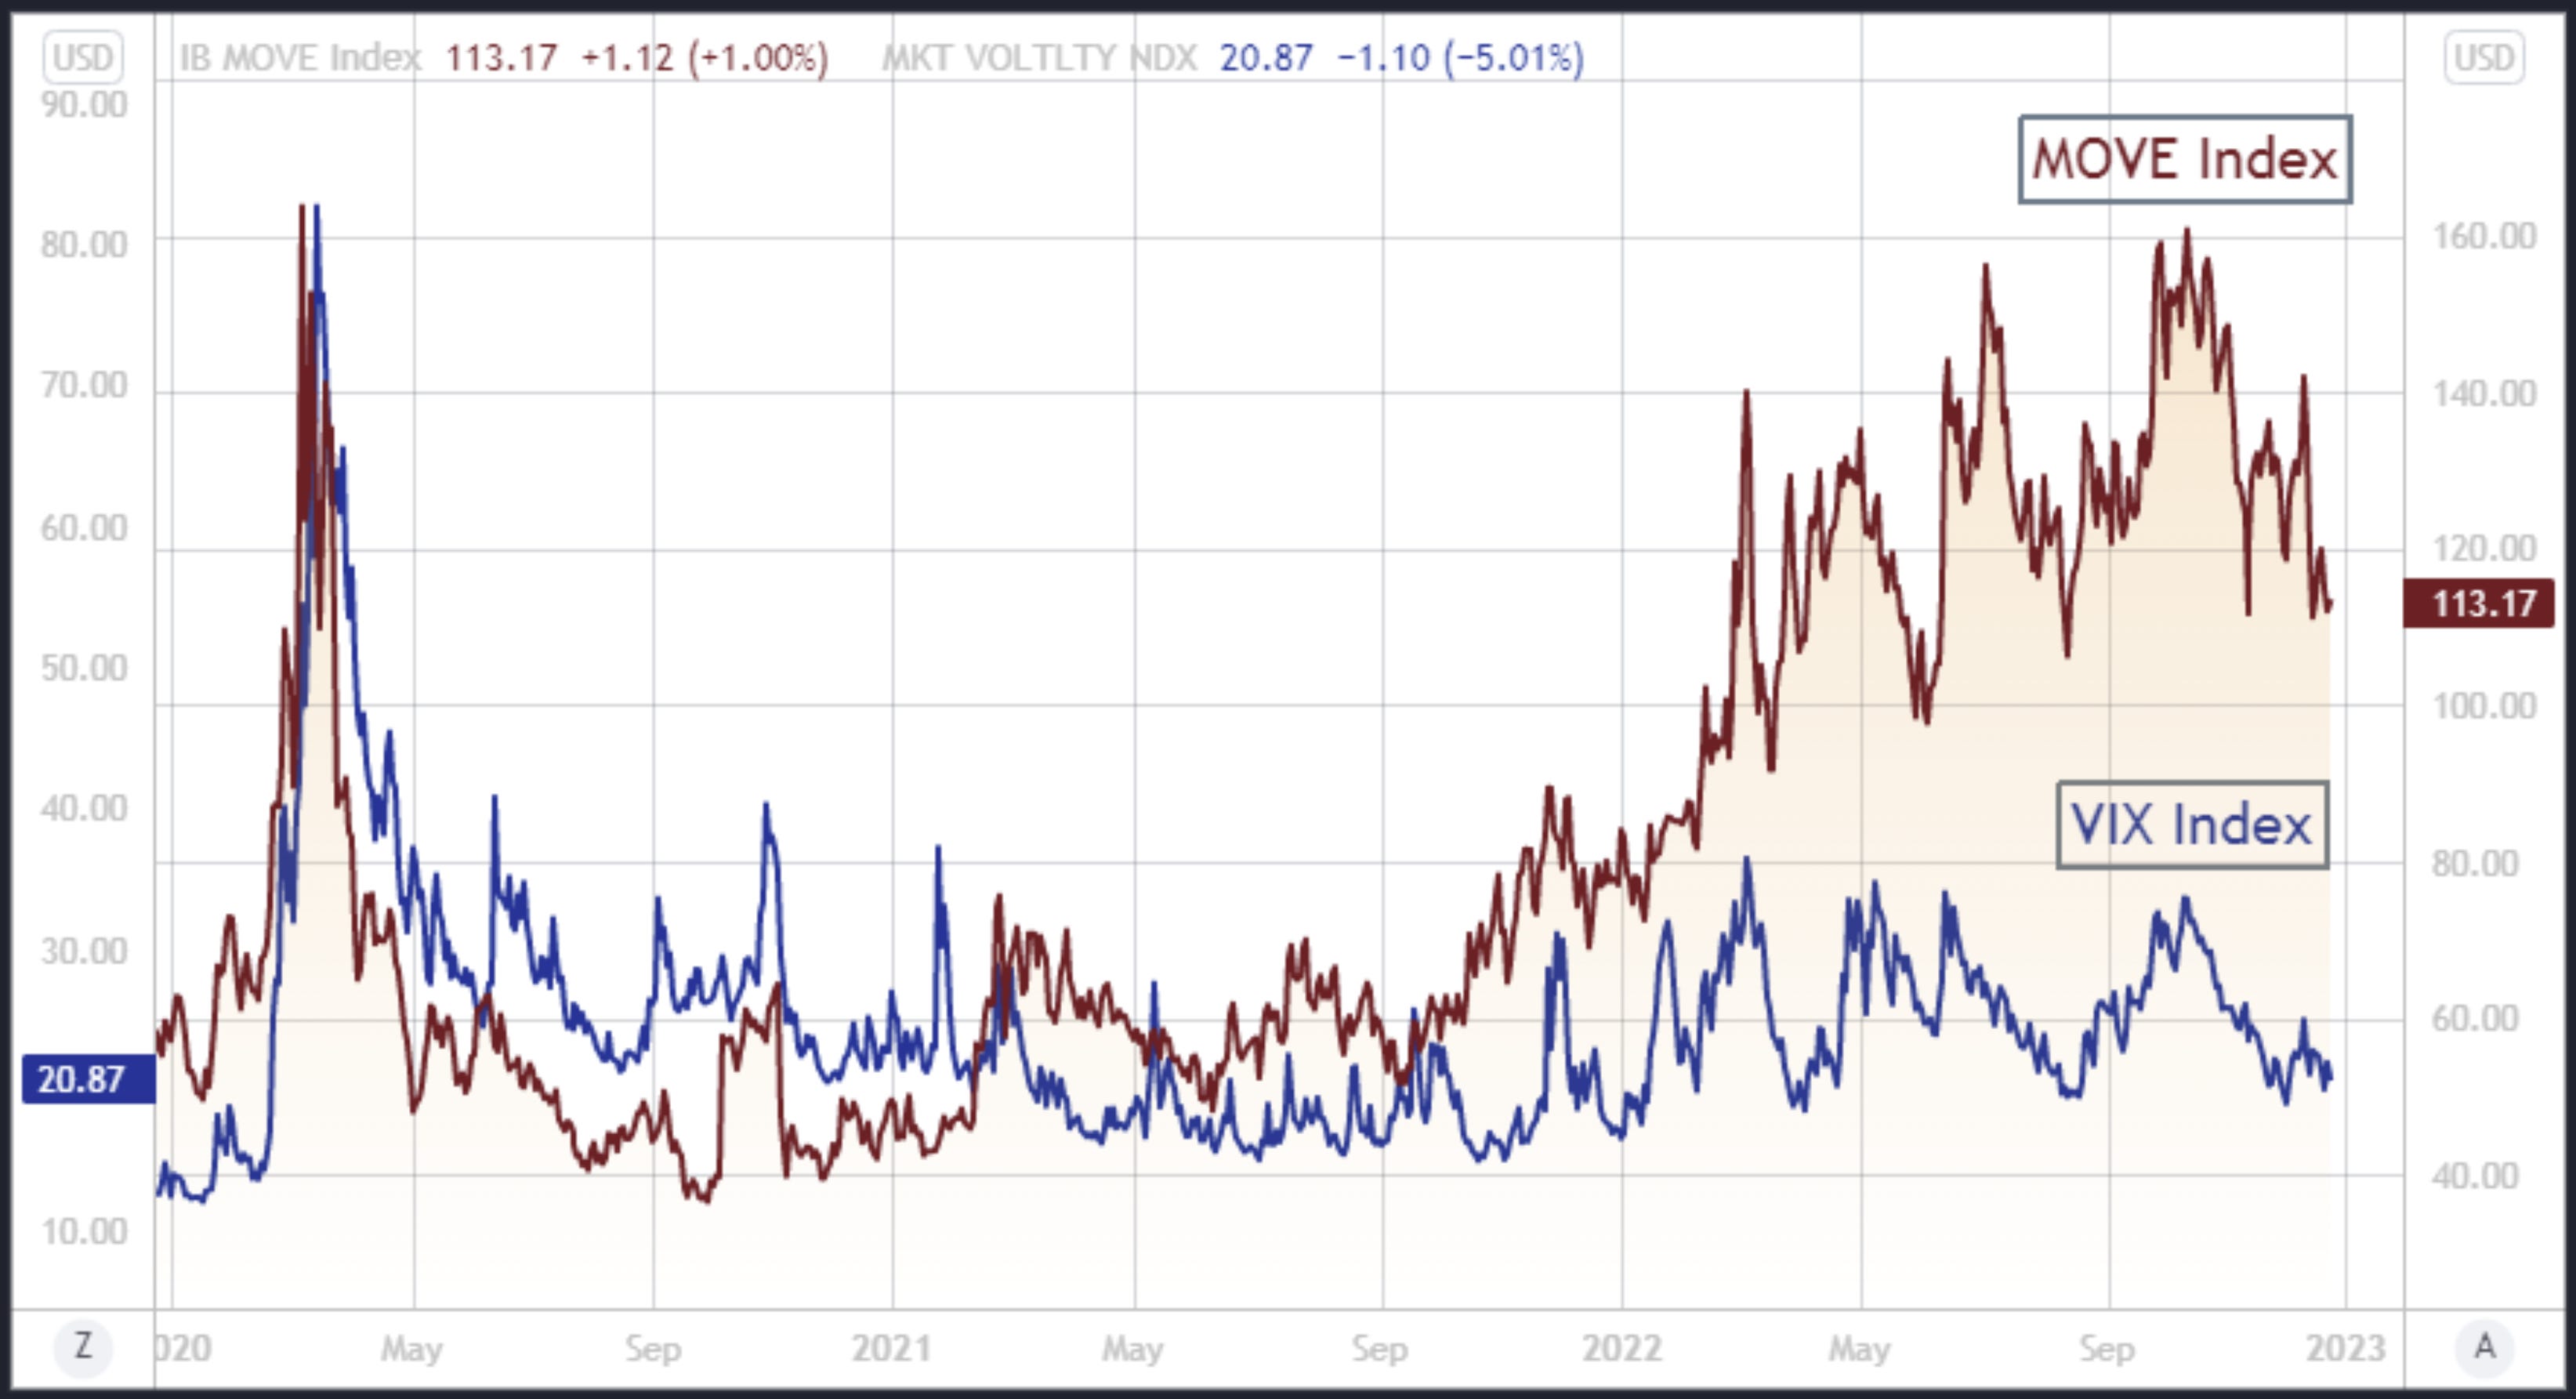
Market positioning in part explains why equity volatility remained relatively subdued in 2022 when compared to bonds. The graph above shows that heading into the Covid market blow-up in 2020, the VIX index was around 10, while heading into 2022, it was nearer 20. Prior to the volatility explosion which led to a sharp equity-market sell off in February 2018, the VIX was also trading around 10.
A very low level of the VIX suggests extreme positioning in terms of investors systematically selling volatility (ie selling options or similar derivatives whose price is driven by implied-volatility levels). This is true for the VIX at 10 but not at 20. With the VIX starting 2022 at around 20, we can infer that the sort of aggressive volatility selling which at extreme levels can catch the market offside (and potentially crash it) wasn’t necessarily going to be a problem last year.
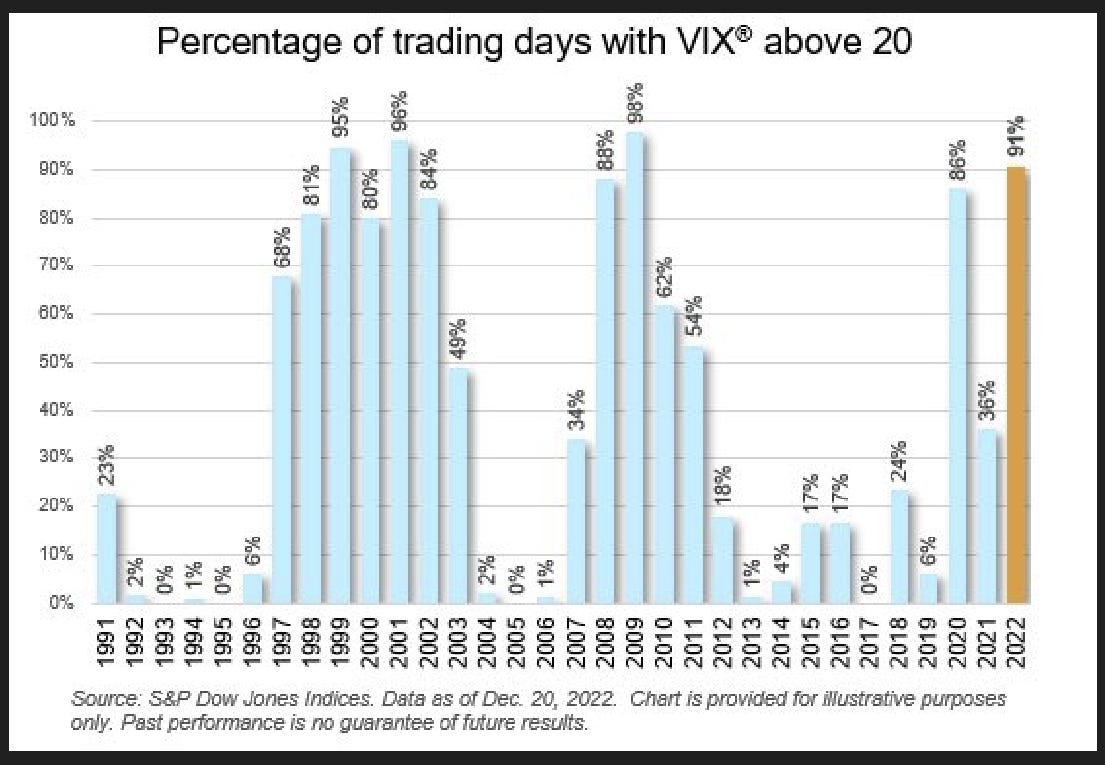
The graph below shows that while the equity market remained volatile throughout 2022 (with the VIX index above 20 for much of the time), it never really suffered a major collapse incident (reflected in a VIX level above 40 for example). at 20, the VIX implies that the S&P 500 should be moving around 1.2% or so a day. Volatile, but not crazy.
Back during ‘Vol-maggedon’ in February 2018, it was in part short VIX ETF’s (exchanged-traded funds) which were the vector for the mega-spike in volatility which dragged equities sharply lower. It was the blow-up in ETF’s such as XIV (the VelocityShares daily inverse VIX note) which systematically sold futures on the VIX index as a bet that realised volatility would remain lower than implied volatility which forced levels of market volatility sharply higher, dragging equities down at the same time.
In 2022, these sort of short-volatility products have been far less popular, and if anything, it may be the recent market trend in trading very-short-dated options (of a maturity of a week or even just a day) which may explain the absence of bigger shifts in the S&P 500 index and the volatility measures based upon it. Some estimates suggest that up to 40% of option-market activity was in these short-dated instruments, a major change from the past.
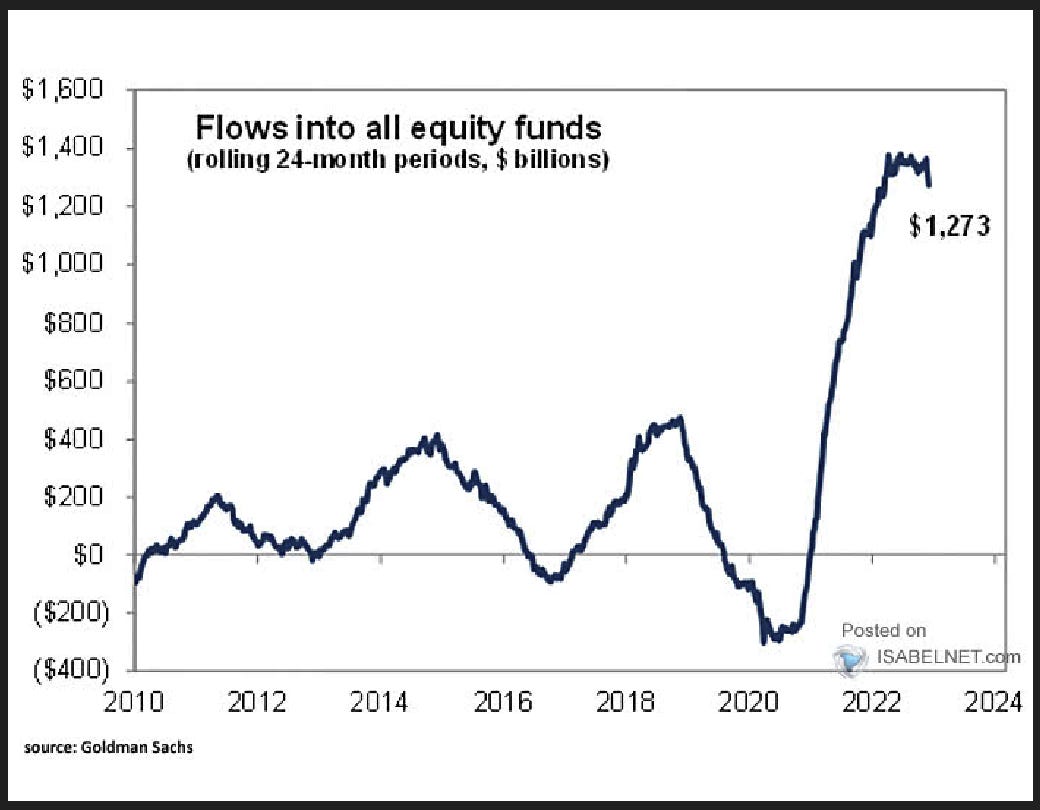
The other key factor in equity stability is that flows continued into the asset class. With unemployment low, workers and their employers continued to contribute to pension funds, and this cash flowed into equities as can be seen from Goldman’s graph above. Likely this cushioning effect was helped by the manner in which much money enters the market through passive allocation and via index funds. Clearly while equities were down in 2022, there was no capitulation event. Quite the opposite - many market commentators still seem to think every market dip is a lucky dip.
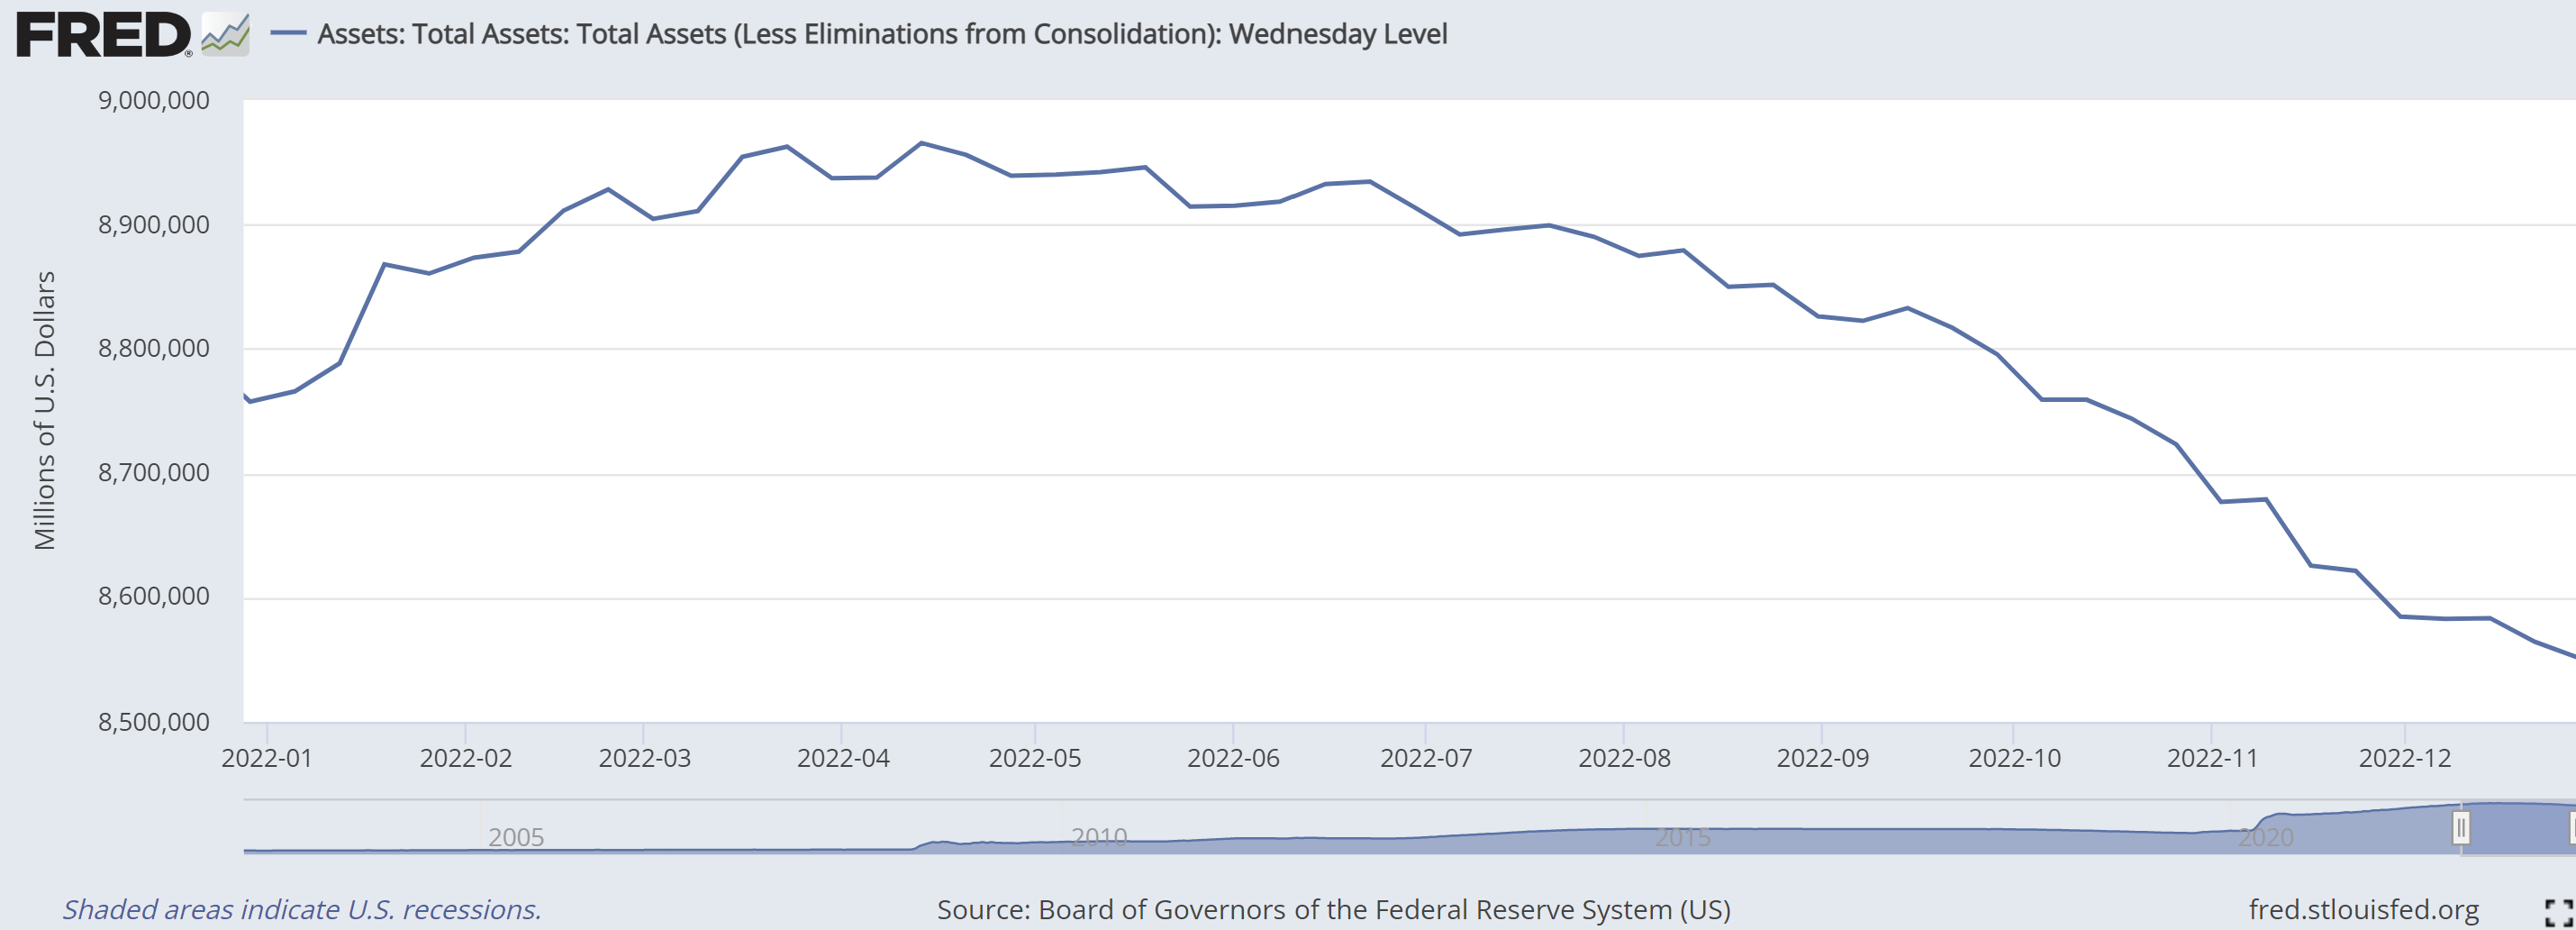
The other part of the liquidity story for equities is the Fed’s balance sheet. At it’s most basic level, quantitative easing (QE) by the Fed added liquidity to the financial system, pushing asset prices up as investors are forced to buy riskier and longer-duration assets. This process goes into reverse when the Fed’s balance sheet shrinks, although the process is not necessarily symmetrical.
The graph above shows how quantitative tightening (QT) has shrunk Fed assets from a peak of $9.97 trillion to around $8.55 trillion by year end 2022. Bad for liquidity, thus bad for equities? When we had Fed rate hikes in 2018 after QT started in late 2017, the stock market crashed 20% in December of that year. It thus seems odd that an equity collapse didn’t happen in 2022 given sharper rate hikes and more aggressive QT than during 2018.
Odd until you consider that the Federal government ran down it’s own balance at the Federal Reserve (the Treasury General Account or TGA) from $945b to $430b by year end 2022, and this liquidity entering the system largely offset the central bank’s own balance-sheet reduction. Consider too that with rates higher, the Fed is now paying out some $16b a week in remittances to banks (via Interest on Excess Reserves or IOER’s) and money-market mutual funds (via reverse-repos or RRP’s), thus pushing more money back into the financial system.
What the aggregate of all these cashflows means is that for 2022, the liquidity crunch from the Fed’s balance-sheet reduction was for the most part offset elsewhere, and while bonds sold off as the Fed hiked policy rates aggressively, equities didn’t collapse as liquidity contracted less than might have been expected. So if liquidity was ok, what actually made equities sell-off? This is where valuation comes into play.

The graph above from FactSet tracks the S&P 500 (blue) against Wall Street earnings estimates (black). The fall in the overall index level during 2022 reflects in part falling forward earnings estimates and in part the effect of rising interest rates reducing the present value of future corporate earnings from which equity valuations are derived (ie the discount rate applied to estimated future corporate cashflows).
With the S&P 500 finishing the year at 3839.5 and with an estimated earnings level of around $230, the index is entering 2023 on a forward earnings multiple of just under 17x versus a long-term average of around 14x, so equities hardly look cheap on a historical basis. Factor in falling earnings in 2023 if there is a recession (a situation which various macro leading indicators and a highly-inverted US yield curve are screaming), then one can clearly state that at present, equities aren’t pricing in a meaningful slow-down in the US economy.
When equities trade above their long-term average valuation levels in terms of the price to equity ratio (the P/E) or any other multiple one should choose, it is often said that the market is pricing in future earnings surprises. When stocks fall and these multiples fall back to their long-term averages (the process of mean-reversion), this surprise seems to come out of stock prices. This looks to be the sort of thing that happened in 2022.
Yet it seems very odd to talk about the idea of ‘surprises’ being priced into stocks. Either one is surprised or one is not, and to talk in terms of ‘degrees of surprise’ seems equally strange, either with respect to the positive or the negative. If there is a surprise, one would assume the stock price would jump or fall, depending on the nature of the news. One cannot really price surprises in advance.
A much clearer way of thinking about problem is to think of investors as having an ever-changing time horizon, which extends with the infinite possibility of blue-sky thinking during a market (or economic) expansion but which contracts sharply during a bear market (or recession). This is slightly different to the simple idea of optimism and pessimism or bullishness and bearishness due to the sequence of events by which it happens.
If one thinks of inflation as forcing people to focus more on the day-to-day (through the cost of living in terms of rising food and energy costs for example), one can imagine people’s time horizons shrinking from the future to the everyday as the bills mount up. Central banks hike interest rates to deal with the inflation, and this in turn shortens investors’ time horizons in the same way since higher rates raise the cost of money and thus make betting further out into the future more expensive.
As interest rates (the price of time) rises, so to do investors’ time horizons shrink. There are no surprises or degrees of surprise to be seen. This is just the description of what happens in an economic slowdown or recession.
In booms, investors’ time horizons for growth and prosperity extend off into the infinite. The best example of this is still the dotcom boom, when a new industry emerged in which the old rules didn’t apply and thus wealth creation would be unlimited. The precipitous collapse of this mirage was best articulated by Scott McNealy, then CEO of Sun Microsystems, writing in The Business Insider in 2002 as the air came out of the bubble:
‘At 10 times revenues, to give you a 10-year payback, I have to pay you 100% of revenues for 10 straight years in dividends. That assumes I can get that by my shareholders. That assumes I have zero cost of goods sold, which is very hard for a computer company. That assumes zero expenses, which is really hard with 39,000 employees. That assumes I pay no taxes, which is very hard. And that assumes you pay no taxes on your dividends, which is kind of illegal. And that assumes with zero R&D for the next 10 years, I can maintain the current revenue run rate. Now, having done that, would any of you like to buy my stock at $64? Do you realize how ridiculous those basic assumptions are? You don’t need any transparency. You don’t need any footnotes. What were you thinking?’
One can spot bubblicious valuations when people start talking in terms of price-to-sales (revenue) multiples rather than the more conventional price-to-earnings ratios as McNealy points out in the quotation above. 2022 has seen those type of stocks (the mega-growth tech sector) really collapsing as the prospect of amazing profits earned over a seemingly infinite time horizon fell back down to reality.

This idea of inflation shrinking time horizons towards the day-to-day in the real economy and the subsequent effect of central-bank policy tightening doing the same in the financial economy is perhaps the best way to look at asset allocation heading into 2023.
Given the recession risk, 2-year US treasuries yielding around 4.3% doesn’t look such a bad bet relative to equities on a valuation basis. History shows that in a recession, equities tend to bottom a year and half or so after the Fed pauses its hiking cycle, so that point seems some way off given the Fed is still in hiking mode.
The caveat is of course that if there is a market event in 2023 - a crash of some sort, either in the equity market or more dangerously in the Treasury market, then the likely Fed liquidity response will once again reanimate the equity speculation beast, at least in the short term. Once again, 2023 is going to be a very trick one for investors…