

The UK housing market - is there such a thing as a 50 year bubble?
The UK housing market - is there such a thing as a 50 year bubble?

There are things one doesn’t talk about at dinner parties - politics and religion have always been infra dig, as has Brexit more recently. Property prices on the other hand have always been a stalwart of conversation over the coffee and petit-fours, with ever-rising prices inducing much knee-rubbing and glee. With higher interest rates due to high inflation, the property market in the UK and elsewhere is starting to turn, so perhaps the thrills that people get from talking about the ‘mills’ their houses are worth might start to abate a bit.
After World War I, approximately a quarter of houses in the UK were owner-occupied. Ownership finally overtook renting in the 1970s, and grew exponentially under the Thatcher government’s Right-to-Buy policy in the 1980s to reach a peak of around 70% in 2007, before drifting lower following the global financial crisis (GFC) as banks tightened lending standards1. Even after the GFC, ultra-low interest rates and government policies such as Help-to-Buy have continued to drive the Brits’ obsession with the home-ownership dream.

When the press starts to talk about house prices falling, it always causes a sense of unease, particularly in the UK where rising prices have become somewhat of an article of faith. The Daily Telegraph, the newspaper of reference for conservative middle England, has run a series of articles recently about how a house-price crash will crush UK retirement dreams (Telegraph link) as well as an even more dramatic article about how the UK is entering a ‘property ice-age’ (Telegraph link).
The articles themselves aren’t that outlandishly cray-cray - one references a study by broker and financial advisor Hargreaves Lansdown on the negative effect on retirement savings from a potential 18% fall in house prices. The other references a Bank of England study linking the long-term rise in house prices to falling real interest rates, a process which may reverse should inflation prove sticky and interest rates remain high.
The fun, as ever, comes in the comments section of these articles. These range from the dismissive (“bloody scaremongering”, “silly article”, “still waiting for the crash”), to the quasi-economic with a dash of brexit racism (“Not going to be a surplus if we keep getting immigrants here”) to sherry-sipping zen from the commuter-belt (“house prices go up, house prices go down, and then, they go up again. Magic”).
For the still-waiting crowd, a cursory glance at the recent annual letter from Jeremy Grantham, CIO of GMO asset management, ought to remind them that property prices adjust slowly and bubbles take time to pop2. Mr Grantham points out that the housing bubble that peaked in the US in 2006 only bottomed-out in 2011, some six years later. Basic common sense suggests that it’s only new buyers and those refinancing who are directly affected by the new, higher mortgages rates, so the process of adjustment is an incremental not a universal one at this stage.
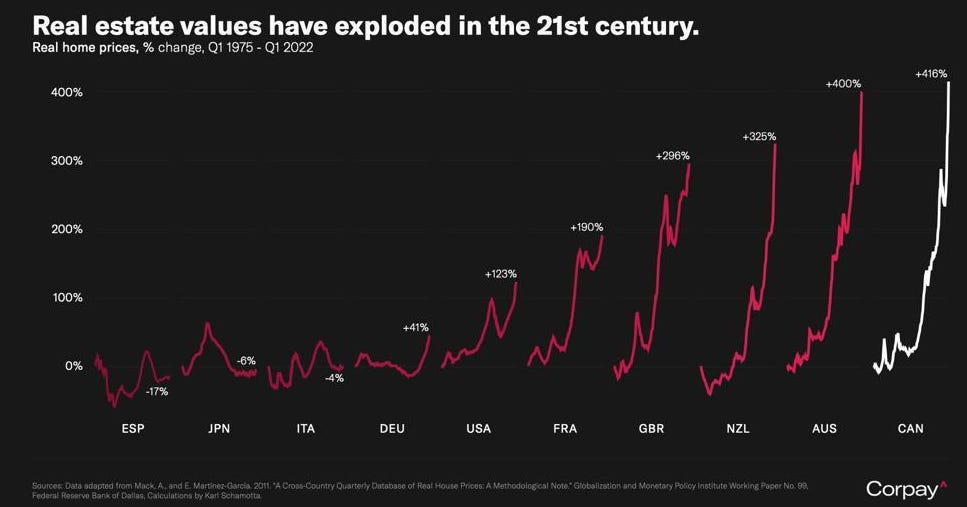
Judging by the graph above courtesy of Corpay, our Zen master looks pretty wise - house prices go up sharply, drop a bit, then go up a whole load. Magic indeed. People (and politicians) like to focus on the supply and demand side of housing itself because it is tangible. The population rises, so that means more houses are needed, that’s what pushes prices up and so on.
Population growth and changing patterns of household formation explain some of the property-price rise. According to ONS data, the UK population was 56.2mm in 1975 and is estimated to have been 67.8mm in 2022, a rise of 20%. With real (ie inflation-adjusted) home prices up 296% during the same period, clearly something else is going on in addition to mere supply and demand of bricks and mortar.
The math-heavy Bank of England study by David Miles and Victoria Monro mentioned in the Daily Telegraph article above (Link - BoE paper) finds a quite specific link between real interest rates (ie excluding inflation) and real house-price growth. They concluded that a 5.5% fall in index-linked (ie inflation-adjusted) bond yields between 1985 and 2018 is likely responsible for a doubling of real house prices during that period, and thus a 1% rise in real rates could cause a long-term fall in house prices of 20%.
So what has happened to UK rates in the last year or so? At the end of 2021, the Bank of England started hiking the bank rate from a post-Covid low of 0.1% to a current level of 4%. 1-yr forward Sonia swaps are currently 4.53%, meaning the market is pricing around another 0.5% of rate hikes from here.
Bank of England data as of the 2nd March shows 10yr nominal Gilt yields at 3.82% and inflation-adjusted real rates at 0.42%. A year ago in March 2022, 10yr nominals were at 1.63% and 10yr reals were negative 2.65%. If one were to apply the Miles/Monro logic that a 1% change in real rates moves property prices by 20%, then the increase in real rates in the last year of 3.07% would imply a 60% fall in house prices over the long term. OMG and some.
Hold on a second. There are a lot of moving parts here. January CPI inflation in the UK was 8.8%, and the market is somewhat blithely pricing in a long-term mean reversion to a considerably lower inflation rate (the difference between current 10yr nominal and real yields implies that inflation will be 3.4% in 10 years time). A recent research paper by Arnott and Shakernia of Research Affiliates on the duration of periods of inflation (Research Affiliates link) suggests that when inflation gets to 8%, it tends to go higher 70% of the time but also that reverting back to 3% when it’s been at 8% can take anywhere from 6 to 20 years.
What this means is that long-term UK inflation expectations may well be far too sanguine, and real rates should be lower (ie less bad for house prices). If there is a recession, the BoE may cut rates, which ought to have some impact at least on the long end of the curve. One also has to factor in the crazy stuff that happened in the UK gilt market last October following the Truss/Kwarteng mini-budget fiasco in the context of the long-term supply and demand dynamics for longer-dated gilts from the UK pension industry. When talking about house prices and inflation, one also has to consider the wider issue of wage demands and the relationship between real and nominal incomes and how that affects mortgage affordability. There are clearly a number of variables at work here, and the Miles/Monro study is caveated as a long-term analysis, not a short-term one.

There is perhaps another way of looking at all of this. During the market madness of the Truss government last year, the price of UK gilts slid sharply and the pound tanked to new lows against the dollar. Events in October were clearly linked to pension-fund distress and the liquidation of derivatives positions of a magnitude great enough to force the Bank of England to intervene.
Wait a minute though. When you see an overly-indebted country with a large current-account deficit whose bond yields are rising sharply and whose currency is simultaneously falling, one is really talking about the sort of risk one normally sees in an emerging market crisis. This is particularly the case when central-bank rate hikes fails to bolster the currency. The problem overlooked in much of the analysis of the last year’s UK crisis was that there had been a crescendo of rising yields and a falling pound all year, and the Truss/Kwarteng debacle was merely the dramatic end point in which the government fell and the central bank was forced to intervene.
It may well be the case that it is the long-term outlook for the UK’s balance of trade as well as the fiscal position of the government which holds the answer to the UK housing market. The choice between unemployment from higher interest rates to defeat inflation or backing off and allowing the currency to weaken as inflation takes hold is a very emerging-market choice that the UK faces, and in many ways it amounts to a choice between electrocuted AC or DC. Very unpleasant either way.
High property prices in the UK could be seen as the inevitable result of a large build up of debt resulting from financial deregulation, easier lending standards, and an extended period of falling interest rates due to disinflation (the result of globalisation, technological advances, savings gluts abroad and other macro inputs). Fifty years of rising house prices might seem like a fundamental shift, but even this has been driven by transitory factors such as demography (especially the impact of the baby-boomer generation) and financial reform, not least the shift from gold-backed money to a floating global currency system after 1971.
The return of inflation means the return of interest rates and as Warren Buffett once said, interest rates are the gravity of asset prices. The political pressure to avoid a housing crash will without doubt be immense, but this time around interventions (rate cuts, quantitative easing, mortgage forbearance and so forth) happening in a period of high inflation will have quite a different impact than it did in the deflationary scenario of 2008. Governments and central banks can control the price of money or the amount of money but not both, and it is in this battle that the destiny of UK household wealth and therefore the housing market will be decided.
A.E. Holmans, Housing Policy in Britain, Office of National Statistics Data, Croon Helm, 1986.