

Season of the Which - asset allocation amidst falling liquidity.
Season of the Which - asset allocation amidst falling liquidity.

It hasn’t been a classic start to the year for global markets, and with Fed Chair Jay Powell’s bravado-laden performance at the Federal Open Market Committee (FOMC) press conference last Wednesday, things may be about to get a lot more difficult. It is not just the overall direction of the stock market in 2022 (down, which is bad), it is the ferocious intraday volatility which makes investing and positioning so difficult to navigate.

Financial markets love rule-of-thumb definitions. Equities down 10% is a correction, down 20% a bear market . While at an index level (S&P500, Nasdaq 100) US markets are floating around the correction level and may perhaps be due some respite in the short term, individual stocks are showing a far greater level of dispersion, with the highest-beta tech and growth names beaten down the most.
As the US stock market tore higher in the summer of 2020, we were told that the stock market wasn’t the economy. So even though the economy was still in partial lockdown, all was cool with ramping stocks prices. On the way down though, we are told that a stock-market crash would mean a recession due to the fall in business confidence and investment, a decline in the wealth effect and so on. Clearly you can’t have it both ways. Some ‘unpacking’ of the current situation is needed.
Starting with the Fed, the FOMC statement on the 26th January was pretty much in-line with market expectations: quantitative easing (QE) to end in early March, then rate hakes, quantitative tightening (QT) to follow the hikes. It was only when Chairman Powell started shooting from the hip in the presser that the market started to sit up and take notice.
Mr Powell wouldn’t deny the possibility of a 0.50% rate hike in March, wouldn’t deny the possibility of subsequent monthly hikes, seemed insouciant to the effect on unemployment of this new ‘humble and nimble’ stance by the Fed, and shrugged his shoulders when asked about the problem of the flattening of the yield curve as a result of more-aggressive Fed policy.
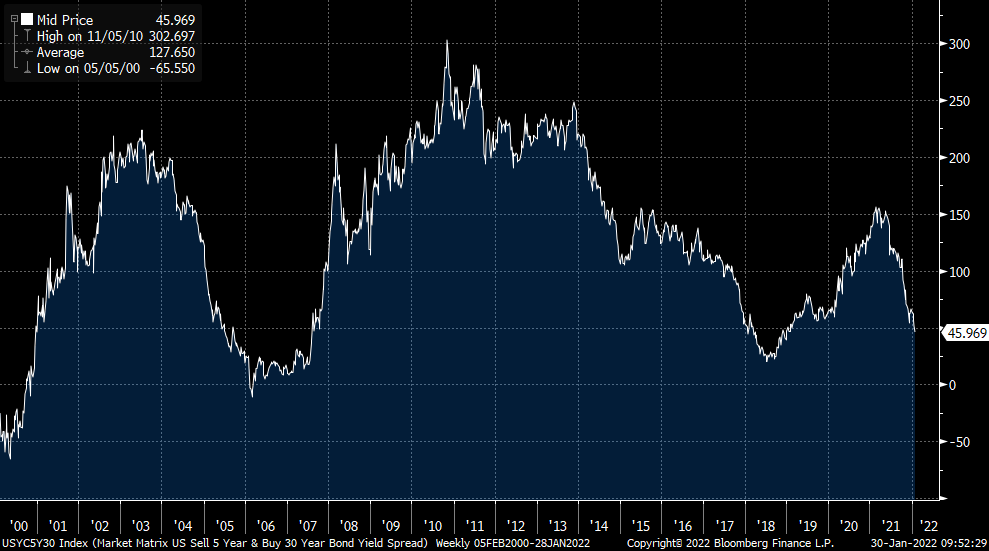
It is this last point which is of supreme importance to the US economy. The short end of the interest-rate yield curve (sub 5yr) tends to reflect expectations of central bank policy while the long end (30yr) better reflects growth and inflation. Curve flattening (when the long end falls relative to the short end) spells two problems, and potentially has two causes.
The graph below shows the spread between the US 5yr and 30yr Treasury yields. from a reflationary peak of 150 bps at the start of 2021, this has fallen to below 50 bps, and is still falling. The composition is key - the long end has rallied (yield falling) while the short end has sold off (yield rising). This means two things: first, the US economy is slowing (long end falling means less growth) and secondly, the Fed is about to get more aggressive with monetary policy (short end rises anticipating rate hikes). Taken together? Fed tightening into a slowdown. Not ideal, to say the least.
During Wednesday’s press conference, Chairman Powell emphasised the tightness of the labour market, so clearly indicated that of the Fed’s dual mandate (price stability and full employment), it is the defeating of inflation, and therefore price stability, which is the key concern at present.
With a current policy rate of zero and CPI inflation at 7%, that means an awful lot of rate-hiking to get inflation back below 2% - the sort of hiking that would crush the demand side of the economy and potentially push unemployment to the high single digits, a situation formerly known as a (bad) recession. It is unclear whether this is in fact possible. Aside from political concerns around mid-term elections in November, the US is set to run a primary deficit in excess of $1 trillion in 2022 and with the overall stock of government debt at 125% of GDP, getting rates up to 3-4% without a sovereign-debt crisis feels a bit like a manned mission to the sun.
The 5s-30s curve graph above shows that the curve is currently flatter than it was in 2019. That was the year of Mr Powell’s big dovish pivot when he stopped hiking rates, started cutting them and then re-started QE to keep the expansion going. The stock market loved it, tearing higher into year end and on into 2020, with only the pandemic in February and March putting a stop to the euphoria. This is where the liquidity issue starts to emerge.
Central bankers make much of inflation expectations and needing to keep them anchored. They are unsurprisingly less keen to talk about asset price expectations and the long history (from Fed Chairman Alan Greenspan onwards) of bailing out the market when the going gets rough. Guessing the strike price of the 2022 Fed put is the real game in town for equities- how much can the stock market legitimately fall before the Fed is pressurised into yet another dovish volte-face.
In the meantime, investors are left wondering what to do. The Fed is still in fact pumping liquidity into the market via QE and will be until March, although it doesn’t feel like it for now. Those who suggest that there is a mechanical link between QE and asset-price inflation have clearly overlooked the key problem of investor confidence, and confidence is where liquidity problems start to manifest themselves.
If one takes a highly liquid instrument like the on-the-run S&P 500 March 2022 index future (ticker ESH1), the normal tradeable quantities on the bid and ask are measured in the hundreds of contracts, sometimes thousands. For the last week or so, that number has dwindled to tens of lots. People (or perhaps machines) don’t want to trade right now.
When you ask market participants what liquidity means, they tend to say something like good liquidity being about getting one’s trade done without adversely moving the price given the volume that they need to trade. This definition of liquidity sits in a first-person perspective. Reality is though that markets don’t trade themselves, and that tangoing is done in two’s. We should think about markets in the first-person, but the first person plural (we) not the singular (I).
This may seem like an obscure point, but it helps to make clear exactly what liquidity is and also the exact nature of the problem the market is currently facing. Rates are still low and the Fed is still doing QE, but people are changing their view about valuation. This is clearly what the bond market is telling us with the curve-flattening discussed above. In order to trade, people need to agree on a price to trade at, but behind this is a disagreement on value. The buyer thinks the value will rise in the future, the seller that it will fall. The degree of conviction about this corresponding rise and fall in value is reflected in the amount the buyer and seller are willing to trade at a given price.
Low volatility relative to trading volumes reflects a liquid market while high volatility relative to trading volumes shows an illiquid market. Liquidity is thus the degree of willingness with which market participants express their implicit disagreement with one another about value.
After the Fed juiced the stock market in 2019, kitchen-sinked it with policy easing in 2020 and then failed to act in the face of clear inflationary pressures in 2021, the market was forced to keep buying in what might be called a rational bubble. TINA (there is no alternative) meets FOMO and you get an everything bubble. Now that the Fed is going all hawkish, people are all having to change their minds at the same time. Finding a conviction buyer in a turning market characterised by full valuations in all asset classes is the very definition of a liquidity problem.
So once everyone is in the pool, it’s pretty hard to get out without a scramble and major market volatility. Welcome to 2022. In an earlier blog from January, the point was made that if the Fed goes gung-ho, it is likely the dollar will rise. A rising dollar tends to be deflationary, and this is bad in a highly-indebted world with very full equity valuations. Dollar strength is the ultimate pain trade, especially for emerging markets whose debt is often denominated in dollars.
If second-guessing the strike on the Fed put is the real goal for investors in 2022, they ought to shift their focus from equities to the US credit market. It was the de facto closing of the credit markets in Q4 2018 which eventually forced the Fed into its dovish pivot. To that extent, the 20% equity-market dump in December 2018 was just a sideshow. In a fully-financialised world, credit is the pressure point.
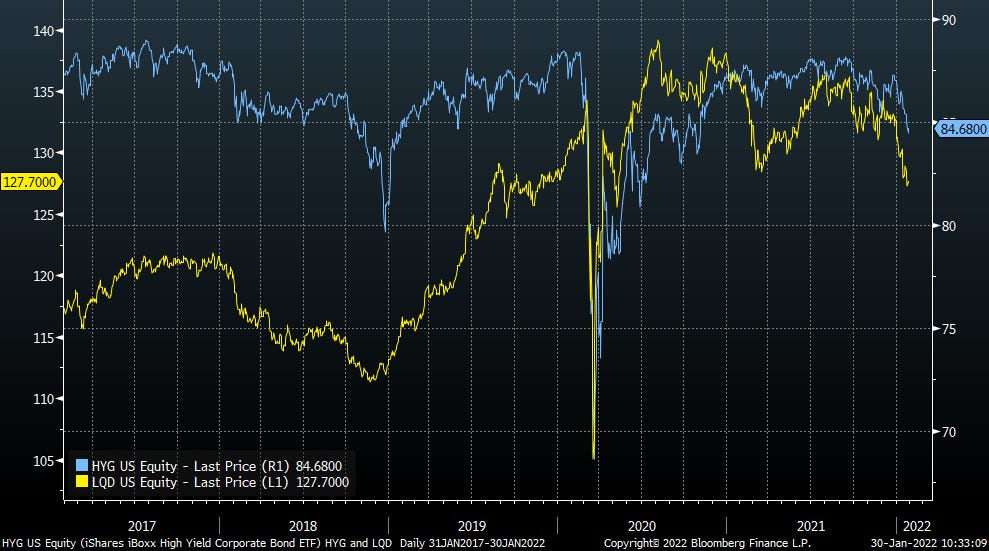
The Ishares iBoxx High Yield Corporate Bond ETF (ticker HYG) and iShares iBoxx $ Investment Grade Corporate Bond ETF (ticker LQD) are two key instruments to watch when tracking credit sensitivity to potential Fed policy errors and a slow down in the US economy (see below, HYG in blue and LQD in yellow). Not only are they good overall barometers of credit sentiment, but the ETF structure itself is particularly sensitive to dislocations in market liquidity, especially when the market price of the ETF itself trades at a sharp discount to its components (ie a large discount to net-asset value or NAV).
The Fed has already implemented an assortment of repo and swap programmes to help with dollar liquidity, so it arguable there is a point at which the dollar stops going up. A falling stock market may also lead to a fall in the dollar as foreign investors repatriate their assets. It is in the corporate credit market where the fulcrum between the financial economy and the real economy exists.
Recessions are generally characterised by periods of corporate and household balance-sheet repair (ie paying down debt), and these periods are in turn initiated by a fall in credit quality and a widening of credit spreads. Some sell-side institutions are talking about 5 or even 7 Fed hikes this year. The market is pricing around 1.25% of hikes by year end. Credit markets are now the barometer to measure when the Fed’s tightening pressure becomes too much to handle.